Network Observability Topics

    Network Observability

    Turn comprehensive network telemetry into the actionable intelligence required to proactively understand, troubleshoot, and resolve any performance issue.

    Last Updated: August 6, 2026

    What is Network Observability?

    Network observability is an evolution of network monitoring that provides deep, contextual insight into a network's state. By correlating diverse telemetry—including metrics, flows, user experience, active synthetic tests and more—it enables teams to not only see what is broken but to understand why and where performance issues are occurring across the entire network delivery path, from the user to the cloud.

    According to research from the 2026 GigaOm Radar for Network Observability, modern enterprise network observability extends beyond traditional monitoring. By combining comprehensive telemetry with AI-enabled analytics, it delivers proactive operational intelligence across hybrid, multi-cloud, and ISP environments.

    Key capabilities defining modern network observability include:

    • AI/ML-Driven Proactive Operations: Shifts teams from reactive troubleshooting to predictive issue isolation, surfacing network anomalies before they affect the end-user experience.

    • Unified Telemetry & Path Correlation: Seamlessly integrates hop-by-hop path performance with SNMP, streaming telemetry, flow records, and packet data into a single operational view.

    • End-to-End User Experience Insights: Connects physical and virtual infrastructure metrics directly to user experience across managed campus, cloud, and third-party ISP networks.


    Core Principles of Network Observability

    Effective network observability relies on foundational practices that transform how teams detect, contextualize, and resolve performance issues across modern digital ecosystems. These core principles guide IT operations toward complete path visibility and proactive issue discovery:

    • Focus on 'Unknown-Unknowns': Designed to surface novel issues in complex systems, not just alert on predefined failures.

    • Data-Driven Context: Relies on correlating multiple, high-fidelity data sources (passive and active) to build a complete picture.

    • End-to-End Visibility: The scope is the entire delivery path, including third-party networks (ISPs, cloud, SaaS) that are outside of direct control.

    ESD_FY2021_Academy-Blog-Broadcom-Awarded-Highest-Vendor-Score-EMA-Radar-Report.hero
    EMA Radar™ Report for Network Operations Observability

    Learn more about how modern enterprise teams must manage hybrid networks spanning both managed and unmanaged infrastructure.

    Read Report

    How is Network Observability different from Network Monitoring?

    Network observability is an evolutionary expansion of network monitoring that explains why complex issues happen, whereas traditional network monitoring tracks predefined metrics to signal what is broken. While monitoring relies on static thresholds for known failure modes, observability combines passive telemetry with active synthetic testing to surface unknown-unknowns across complex, hybrid delivery paths.

    Comparison Criteria

    Network Monitoring

    Network Observability

    Core Focus

    Answers "What" and "When" an issue occurs (e.g., Is a router down?).

    Explains "Why" an issue occurred and isolates the root cause.

    Operational Approach

    Reactive: Relies on predefined thresholds to flag known failure modes.

    Proactive & Holistic: Investigates complex, unpredictable network behaviors.

    Data Sources

    Traditional, passive data ingestion (Metrics, Logs, and Flows).

    Combines passive data (metrics, logs, flows) with continuous active synthetic testing.

    Visibility Depth

    Device-level telemetry and status checks.

    Deep end-to-end path context across internal and external networks (Cloud, SaaS, ISP).

    Troubleshooting Speed

    Slower; alerts flag anomalies but leave engineers to manually piece together the cause.

    Accelerated Root Cause Analysis (RCA); correlates cross-layer data automatically.

    Relationship

    A foundational component of broader network operations.

    The complete evolutionary state that encompasses and expands on monitoring.


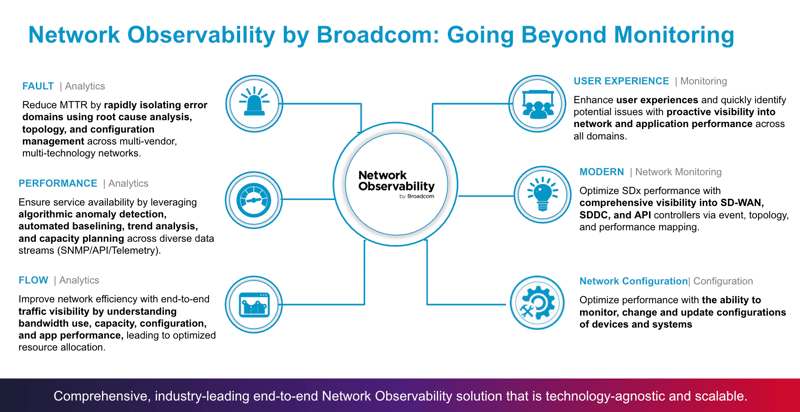
    Diagram titled "Network Observability by Broadcom: Going Beyond Monitoring" showing a central hub linked to six core operational pillars: Fault Analytics (reducing MTTR via root cause analysis), Performance Analytics (algorithmic anomaly detection across SNMP, API, and Telemetry), Flow Analytics (end-to-end traffic and bandwidth visibility), User Experience Monitoring (proactive app performance tracking), Modern Network Monitoring (SD-WAN, SDDC, and API controller visibility), and Network Configuration (monitoring and updating system device configurations). A bottom banner notes it as a technology-agnostic, scalable end-to-end solution.
    Figure 1: Unlike conventional monitoring tools that track siloed metrics, this end-to-end, vendor-agnostic platform unifies six key capabilities—Fault, Performance, Flow, User Experience, Modern SDx, and Configuration Management—to deliver proactive anomaly detection, automated baselining, and accelerated root-cause isolation across multi-vendor networks.


    What are the key components of Network Observability?

    The key components of network observability comprise a multi-layered architecture designed to capture, process, and visualize telemetry across distributed environments: :

    • Comprehensive Data Collection: Gathering a wide range of telemetry including
      • Passive data: metrics, logs, flow records from all network devices
      • Active monitoring data: Results from continuous, synthetic tests that perform hop-by-hop path analysis, monitor BGP routing, and measure DNS performance.
    • Real-Time Path Visibility: Providing continuous, up-to-the-moment insights into network performance and behavior.
    • Advanced Data Analysis: Employ advanced analytics to automatically surface patterns, detect anomalies, and identify performance trends from massive datasets.
    • Dynamic Topology Mapping: Provides an interactive, visual map of the network and its dependencies, showing how traffic flows and components are interconnected.
    • Proactive Issue Detection: Identifying potential problems like performance bottlenecks and capacity limitations before they impact users.

    What are the primary benefits of implementing Network Observability?

    The primary benefits of network observability include accelerated incident response, complete delivery path visibility, and improved NetOps efficiency across modern enterprise architectures. Key benefits include:
    • Minimizes MTTD, MTTR and MTTI: By isolating root causes fast, it reduces both the Mean Time to Detection (MTTD) and the Mean Time to Resolution (MTTR), and establishes a rapid Mean Time to Innocence (MTTI) when third-party networks (ISPs or Cloud providers) are at fault.
    • Eliminates Hybrid Cloud Blind Spots: Extends visibility beyond the private cloud perimeter (such as VMware Cloud Foundation environments) into public clouds and SaaS applications.
    • Validates Major Network Transformations: Establishes precise performance baselines before, during, and after SD-WAN rollouts and cloud migrations.
    • Optimizes End-User Experiences: Shifts IT teams from tracking "green dashboards" to actively monitoring actual end-user network experiences.

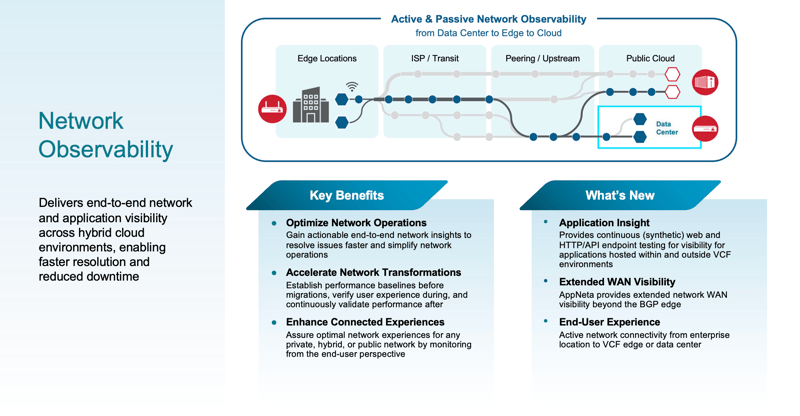
    Diagram detailing active and passive network observability spanning edge locations, ISP/transit, peering/upstream, public cloud, and data centers. The graphic outlines three "Key Benefits": optimizing network operations for faster issue resolution, accelerating transformations via pre- and post-migration baselining, and enhancing connected user experiences. It also highlights "What's New": synthetic web/API application insights for VCF (VMware Cloud Foundation) environments, AppNeta extended WAN visibility beyond the BGP edge, and active end-to-end user experience monitoring from enterprise locations to data centers.
    Figure 2: Hybrid Cloud Network Observability & Extended WAN Architecture. Delivering end-to-end active and passive visibility across edge, transit, peering, and public cloud environments. By combining continuous synthetic application testing across VCF environments with AppNeta extended WAN visibility beyond the BGP edge, organizations can simplify operations, accelerate cloud migrations, and guarantee optimal performance from the end-user perspective.

    What are some common challenges in achieving full Network Observability?

    The primary challenges in achieving network observability stem from architectural complexity, telemetry scale, and legacy operational silos. Market research published in the EMA Radar™ Report for Network Operations Observability identifies tool sprawl and disjointed monitoring silos as major drivers of delayed troubleshooting and inflated MTTR across modern NetOps teams:

    • Data Volume and Scale: Managing, ingesting, and correlating massive volumes of high-velocity telemetry across distributed environments without driving up storage costs.
    • Hybrid and Multi-Cloud Complexity: Maintaining end-to-end path visibility across containerized, public cloud, and third-party ISP networks.
    • Persistent Tool Sprawl: Overcoming fragmented operational views caused by disconnected point tools that delay MTTI and MTTR.
    • The NetOps Skills Gap: Upskilling engineering teams to leverage modern streaming telemetry, OpenTelemetry standards, and algorithmic analysis effectively.
    2026 State of Network Operations Executive Overview-1
    2026 State of Network Operations Executive Overview

    To see how enterprise teams are eliminating cloud blind spots and overcoming tool sprawl, read this new report.

    Read Now

    What kind of tools are used for Network Observability?

    Network observability tools are enterprise-grade platforms that integrate multi-vendor telemetry with active synthetic testing to supersede legacy NPMD utilities.

    Modern platforms leverage:

    • Unified Telemetry Ingestion: Native support for passive data sources including NetFlow, sFlow, IPFIX, SNMP, packet captures, and system logs.
    • Modern Telemetry Standards: Real-time data streaming via gRPC/gNMI, OpenTelemetry standards for NetOps (Metrics, Events, Logs, Traces), and custom APIs.
    • Active Synthetic Probes: Continuous transaction monitoring that simulates end-user workflows and tests path availability.
    • Algorithmic Analytics Engines: Machine-learning models designed to detect performance anomalies, visualize topology dependencies, and perform automated root-cause analysis.

    How does Network Observability relate to a broader observability strategy?

    Network observability is the foundational connectivity layer within a broader enterprise observability framework that includes application and infrastructure observability.

    It connects operational silos by providing:

    • Granular Network Context: Correlates underlying network fabric health (latency, packet loss, BGP shifts) directly with application performance issues.
    • Cross-Domain Visibility: Complements application tracing and server monitoring by filling the "network transit" blind spot between cloud services and users.
    • Unified Operational Workflows: Enables IT, DevOps, and NetOps teams to quickly isolate whether performance degradation stems from application code, server hardware, or network transport.
    ESD_FY25_Academy-Resource.Network Observability for VCF.Featured
    Network Observability for VMware Cloud Foundation

    Learn how to extend complete delivery path visibility across private and hybrid cloud architectures in this Solution Brief.

    Read Now

    What is the role of AI in Network Observability?

    The role of AI in network observability is to serve as an automated analytical engine that transforms high-velocity telemetry into deterministic root-cause insights.

    Key AI applications include:

    • Dynamic Seasonal Baselining: Leverages unsupervised machine learning to establish adaptive thresholds across passive metrics and active probes, replacing static alerts.
    • Topological Event Correlation: Maps multi-layer telemetry against real-time network topology to isolate complex issues like BGP route shifts or cloud gateway drops.
    • Alert Fatigue Reduction: Automatically filters out background operational noise and suppresses duplicate alerts to focus engineering teams on real incidents.
    • Predictive Anomaly Detection: Identifies subtle degradation patterns early to enable proactive remediation before end-user experience is impacted.


    ESD_FY24_Academy-Resource.HCA Healthcare Case Study.Featured
    Case Study: AI-Driven Network Operations in Action

    Learn how a network observability solution empowers HCA Healthcare to achieve a 99.99% reduction in alarm noise, enhancing network management for quality patient care.

    Read Now

    Ready to Make Any Network Work for You?

    Get connected with a Network Observability Expert for a customized, a free consultation, or a deep dive into our roadmap.

    See how Broadcom can help you tame the complexity of modern network infrastructure, optimize valuable NOC resources, and deliver consistently better customer experiences.