

Today’s enterprise infrastructure is undergoing a massive tactical rebalancing.
Driven by unpredictable cloud cost realities, strict data sovereignty regulations, and real-time application latency needs, organizations are shifting away from a strict "cloud-first" mindset toward strategic cloud repatriation and the intentional use of hybrid, multi-cloud architectures.
Workloads now migrate across and beyond traditional corporate boundaries. Modern network operations teams must navigate a complex and highly distributed matrix of infrastructure. In addition to managing on-premises systems, they need to account for third-party networks, such as those of internet service providers (ISPs) and cloud service providers (CSPs).
These modern environments can create severe network visibility gaps and leave operators drowning in a flood of alert noise. (According to a survey of IT professionals by EMA, only about a third of alerts indicate a real problem that must be fixed—the other two thirds are noise.)
AppNeta now features an Intelligent Alarms experience that addresses those challenges. This new experience provides a scalable, highly focused framework to eliminate network visibility gaps and reveal real, persistent network and application issues.
Here’s what the new experience looks like, and how it helps address modern network visibility challenges.
The Intelligent Alarms experience
AppNeta provides end-to-end network monitoring that focuses on the actual user experience. By simulating user traffic and interactions, AppNeta helps your operations teams see what users are seeing and get ahead of performance issues before they have an impact on productivity.
AppNeta’s new Intelligent Alarms system improves usefulness to network operations center (NOC) teams by introducing new alarms and thresholding techniques, new metrics, new workflows, and a new set of dedicated alarm interfaces.
What is the difference between AppNeta Classic and the new Intelligent Alarms experience? Here’s how the two differ.
New alarms are streamlined and reduce noise
In AppNeta Classic, users would configure individual alert profiles for each monitoring policy, which often resulted in many similar configurations across their environment. How do AppNeta’s new features help NOC teams reduce network alert noise? In the new experience, alarms replace alerts and notifications as the signal mechanism for network and web performance issues.
Alarms are smarter and easier to manage than alerts for many reasons:
-
Simpler management and configuration. Alarm rules apply broadly and are easily configured in a single place. This approach is much more streamlined than editing each individual monitoring policy or policy group’s alert profile.
-
Add information about severity level. The new experience classifies alarms with a severity level, so NOC teams can identify the highest priority issues and send only the most severe alarms downstream to their ticketing system.
-
Filter out the noise. You can automatically tag frequent and burst alarms to filter out reoccurring alarms for the same issue.
-
Dynamic baseline thresholds. Alarm rules give you the option to use dynamic baseline thresholds, which detect whether a measured metric differs significantly from typical values for the path.
Smarter metrics
The new Intelligent Alarms experience improves the alarm system in part by restructuring how performance metrics are gathered, evaluated, and displayed. Some of the key advancements include:
-
Minute-by-minute granularity. Performance metrics now operate with minute-by-minute precision, without any data smoothing. This ensures that rapid, severe anomalies, like transient packet loss or momentary outages, are detected immediately.
-
Simplified metrics. Some measures have changed slightly for clarity and ease of interpretation. For example, the calculation of jitter has changed slightly to be consistent with RFC 3550.
-
Shift to time-based metrics. We’re moving away from percentage-based thresholds to time-based thresholds. With the new system, alarms are raised only after errors or metric threshold violations persist long enough to warrant action.
These changes to metrics are designed to allow AppNeta to highlight persistent problems—the ones network operations teams care about—while reducing distraction from temporary blips.
Dedicated alarm interfaces
Along with the Intelligent Alarms system, we’ve added dedicated pages to view, investigate, and track alarms over time.
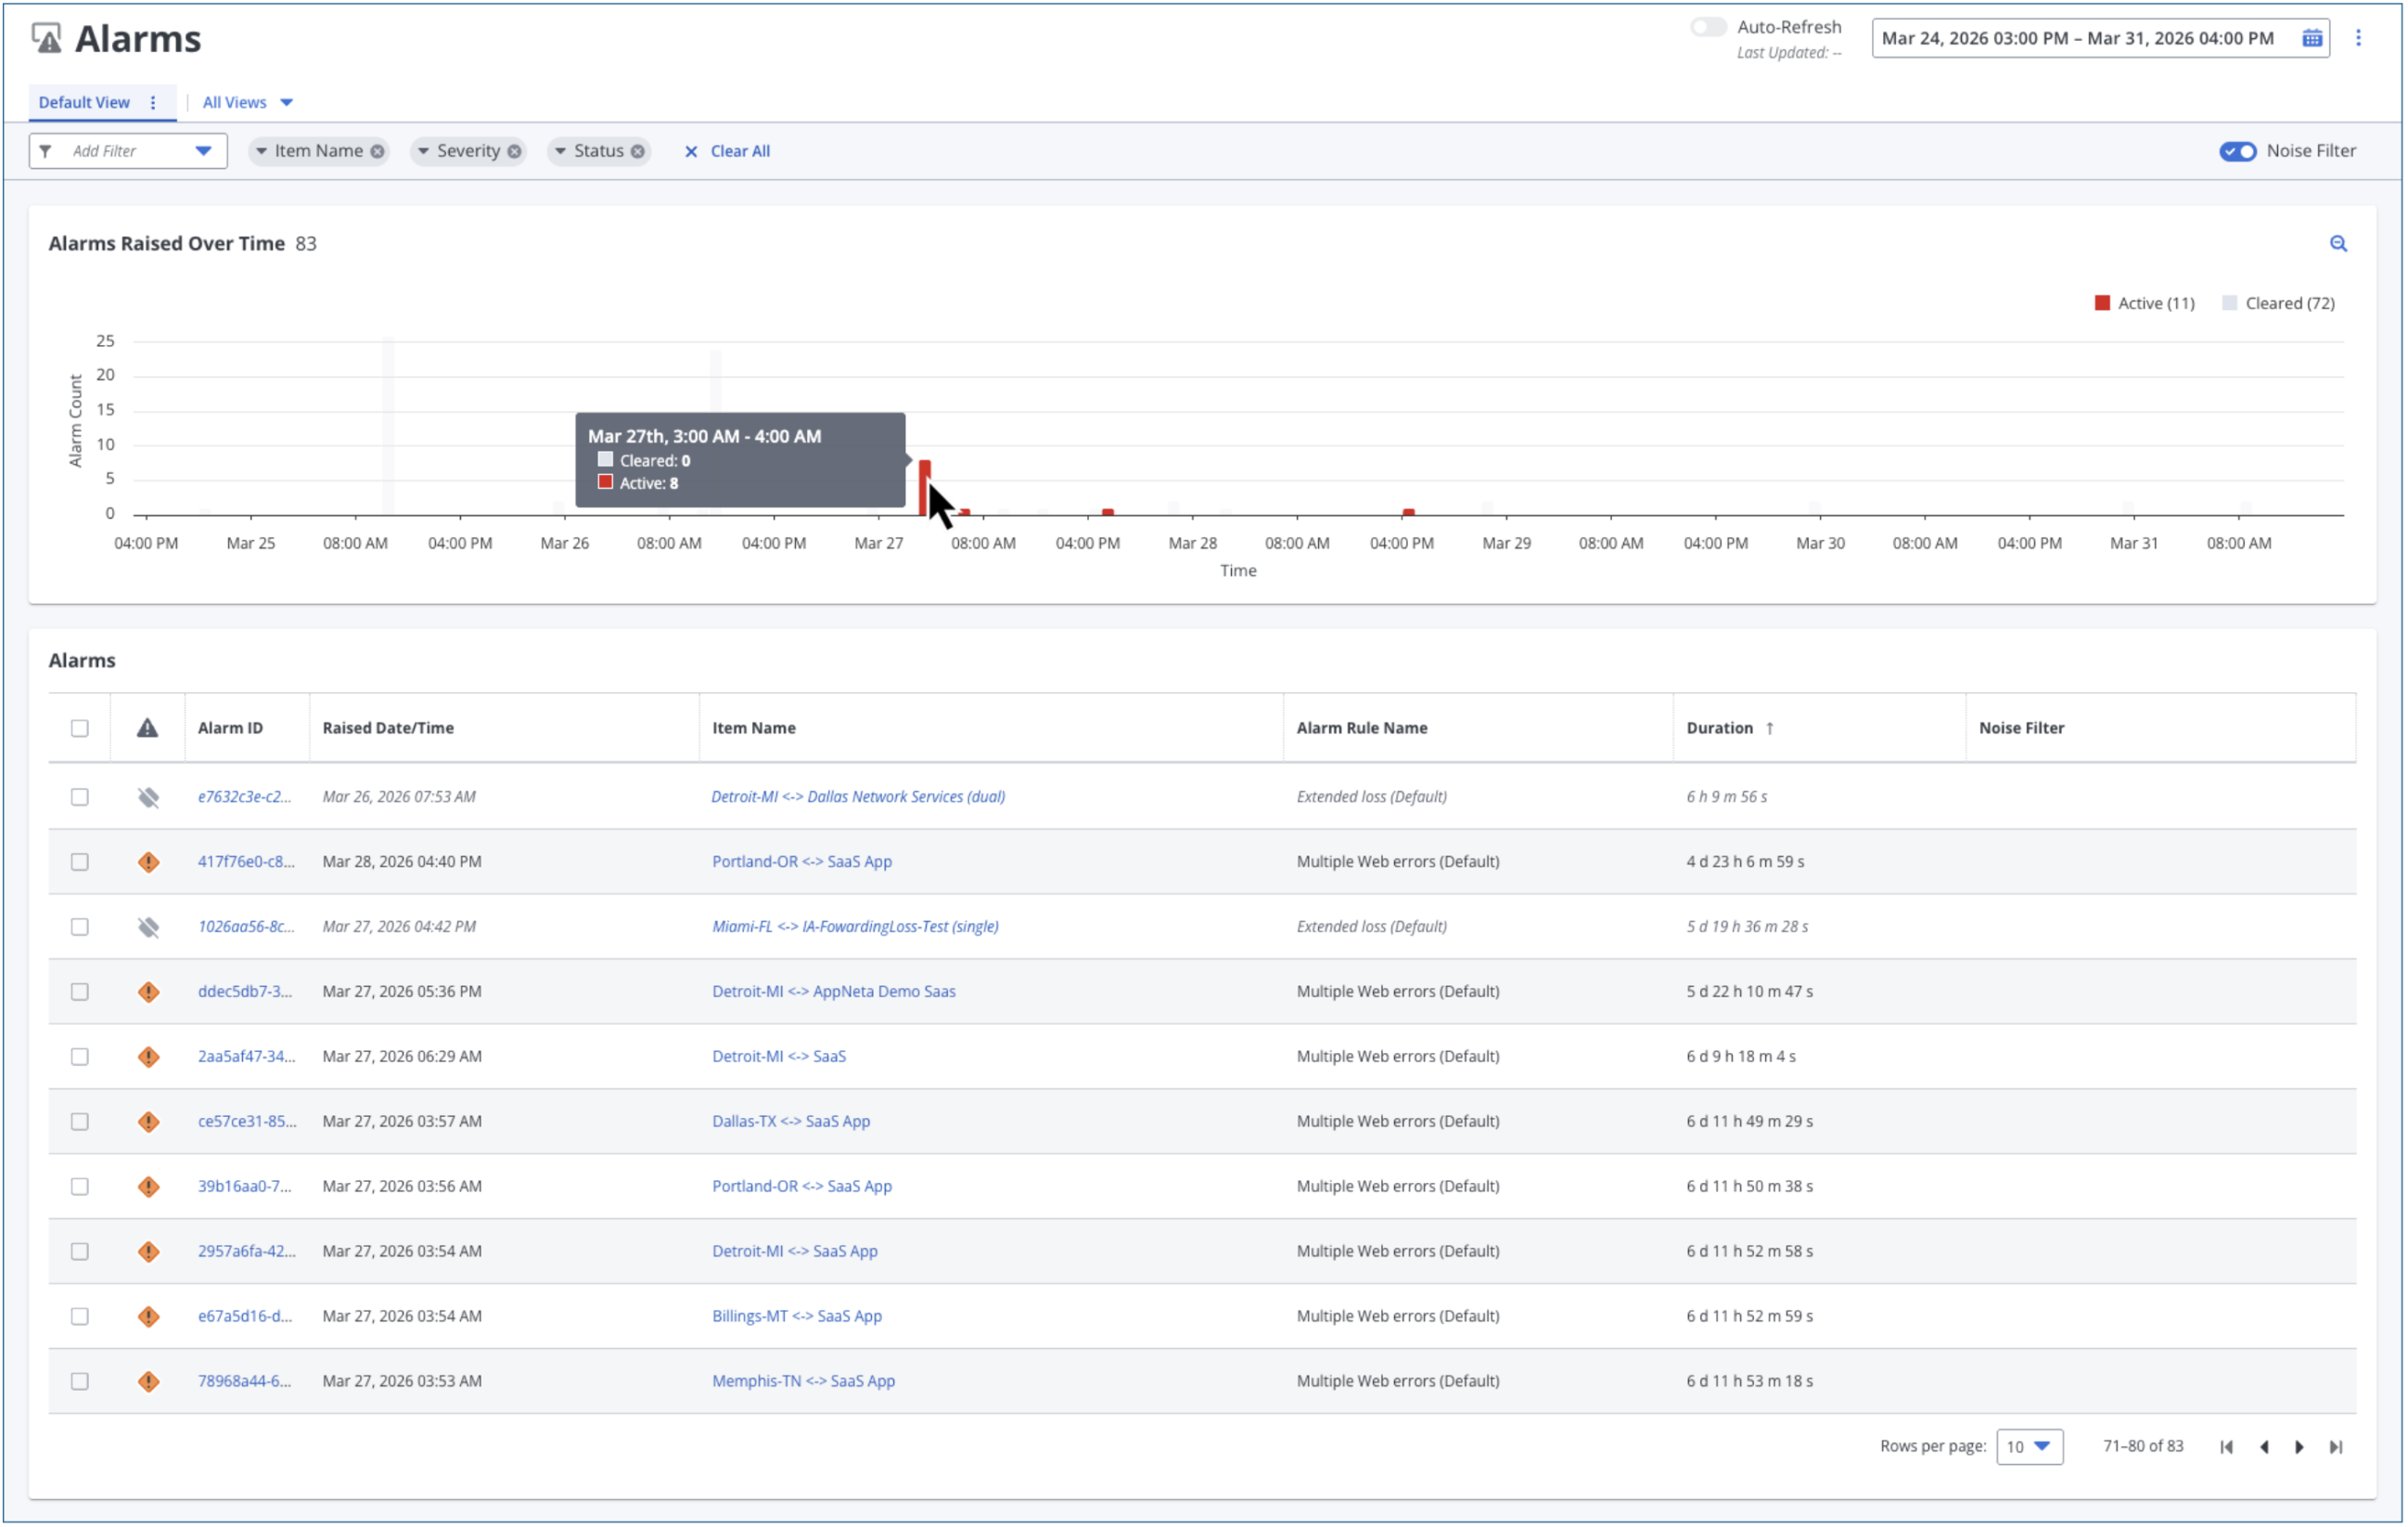
The Alarm Console page provides a view of individual alarms, including those that may not have been sent to a ticketing system.
These changes make it easier for NOC teams to correlate errors, network events, performance metrics, and routes at any point in time. Here are some of the new capabilities:
-
Alarm Console. The Alarm Console provides a central interface to triage active and cleared alarms using a visual timeline chart and built-in noise filters. Operators can isolate specific issues by filtering data by Monitoring Point type or policy group and preserve these configurations using saved views, which can be shared with others.
-
Alarm Details page. Operating as a single-page "one-stop shop," this page displays the exact "first violation time" of a performance issue alongside concurrent network changes like incomplete routes. Use this page to drill down into each alarm’s cause and context.
-
Alarms Summary page. This page provides a high-level, historical assessment of overall deployment health by breaking down alarms by severity and identifying your infrastructure's "top offenders." Use this page to explore historical alarm trends across Monitoring Points or destinations.
-
Interactive charts. The new Intelligent Alarms experience uses new interactive charts to display monitoring and performance data. Operators can click any timestamp along the chart to instantly populate a dynamic side panel that features host, path, and wireless metrics for that exact moment.
-
Alarm connector. Users can also set up an alarm connector to stream a filtered set of alarms to downstream notification and ticketing systems. NOC teams can review alarm details in their ticketing system, and then, when necessary, use a link in the ticket to access the relevant alarm in AppNeta.
See our TechDocs to learn more about the differences between AppNeta Classic versus AppNeta with Intelligent Alarms.
Benefits: Less noise, more insight
The new Intelligent Alarms system is engineered to provide an optimized, NOC-friendly monitoring workflow by dramatically sharpening your signal-to-noise ratio. Here are some of the advantages the offering delivers:
-
Identify critical problems faster. AppNeta highlights the most severe path issues and isolates "top offenders," such as specific target paths or noisy locations, so NOC teams know exactly where their attention is required.
-
Cut through the noise. AppNeta can automatically isolate and suppress frequent, redundant, or low-priority alarms. For example, instead of flooding your console during a temporary network flap, identical alarms can be filtered into the background, allowing your team to focus exclusively on fresh infrastructure issues.
-
Accelerate root-cause analysis. Rather than digging through dense tables of raw diagnostic data, the new Intelligent Alarms experience automatically detects major network changes and presents them on an interactive timeline. This allows operations teams to quickly separate packet loss from latency, view route changes, and track behavior trends over time.
-
Streamline workflow integration. Use advanced webhook connectors to precisely filter and push high-severity alerts directly to downstream ticketing platforms like ServiceNow or messaging tools. You can route only the most critical incidents to minimize workload and prevent teams from being overwhelmed.
Learn more about these advantages by viewing our SMALL BYTES webcast titled, "AppNeta Intelligent Alarms—Focus Your NOC on What Matters Most."
A smarter foundation for network monitoring
As of the first general availability release, all organizations have access to the new Intelligent Alarms experience. Existing customers with established implementations will have ample time to try the new experience and to plan on when to make a permanent transition from AppNeta Classic to AppNeta with Intelligent Alarms.
The new alarms system reflects our goal to provide meaningful, timely insight—not just more data. With more relevant signals, better dashboards, and smarter rules, Intelligent Alarms help teams take the right action faster.
Stay tuned for more updates as we continue to evolve the platform. In the meantime, check out what else was announced in the summer release of Network Observability by Broadcom. In addition, be sure to see our SMALL BYTES session, "Introducing Our New Intelligent Alarms Training for AppNeta."
Frequently asked questions
Q: What is the main difference between AppNeta Classic and the new Intelligent Alarms experience?
A: While AppNeta Classic required configuring alert profiles for each individual monitoring policy, the Intelligent Alarms experience simplifies management by applying unified rules broadly and introducing severity levels, dynamic baseline thresholds, and noise-filtering capabilities.
Q: How does the new system reduce alert noise?
A: The system shifts from percentage-based to time-based thresholds. The result is that alarms are only raised when a performance issue persists long enough to warrant action, rather than being triggered by temporary network blips.
Q: What dedicated alarm interfaces are available in this new experience?
A: Operators can triage active issues via the central Alarm Console, drill down into root causes using the Alarm Details page, track overall deployment trends on the Alarms Summary page, and view point-in-time metrics in interactive charts.
Q: Can I integrate AppNeta Intelligent Alarms with my existing IT service management tools?
A: Yes, you can set up webhook-based alarm connectors to stream a filtered set of high-severity alarms directly into downstream ticketing and notification systems like ServiceNow.


