


When major cloud services experience widespread disruptions, such as the recent Microsoft outage on November 12, 2026, the impact is twofold:
-
First is the obvious—lost productivity followed by the flood of user questions and tickets.
-
Second is the long tail of root cause analysis, investigation, and post-incident reporting.
Your IT and network operations teams may manage the applications, or they may simply consume them from SaaS partners. No matter what, you need a fast, reliable way to understand user impact and determine if an issue originates within your internal infrastructure or a vendor's network.
Modern hybrid environments rely on a complex set of web and network interdependencies. When service degradation occurs, enterprise visibility across both internal paths and external provider networks becomes essential for rapidly isolating the issue. Complete network observability provides IT teams with real-time performance data from the end-user perspective, transforming uncertainty into actionable clarity.
In the following section, we walk through the step-by-step timeline captured by AppNeta during the November 12 outage, demonstrating how active monitoring pinpointed the scope, persistence, and network path behavior in real time.
Anatomy of an outage: Timeline of events
Reported Incident Window: November 12, 2026, at 16:20 UTC to November 13, 2026, at 16:10 UTC
AppNeta detected a degradation in network access to Microsoft Email services (outlook.office.com) starting between 17:00 and 18:00 UTC on Nov. 12, 2026. The degradation first appeared from paths continuously testing with small packet trains.
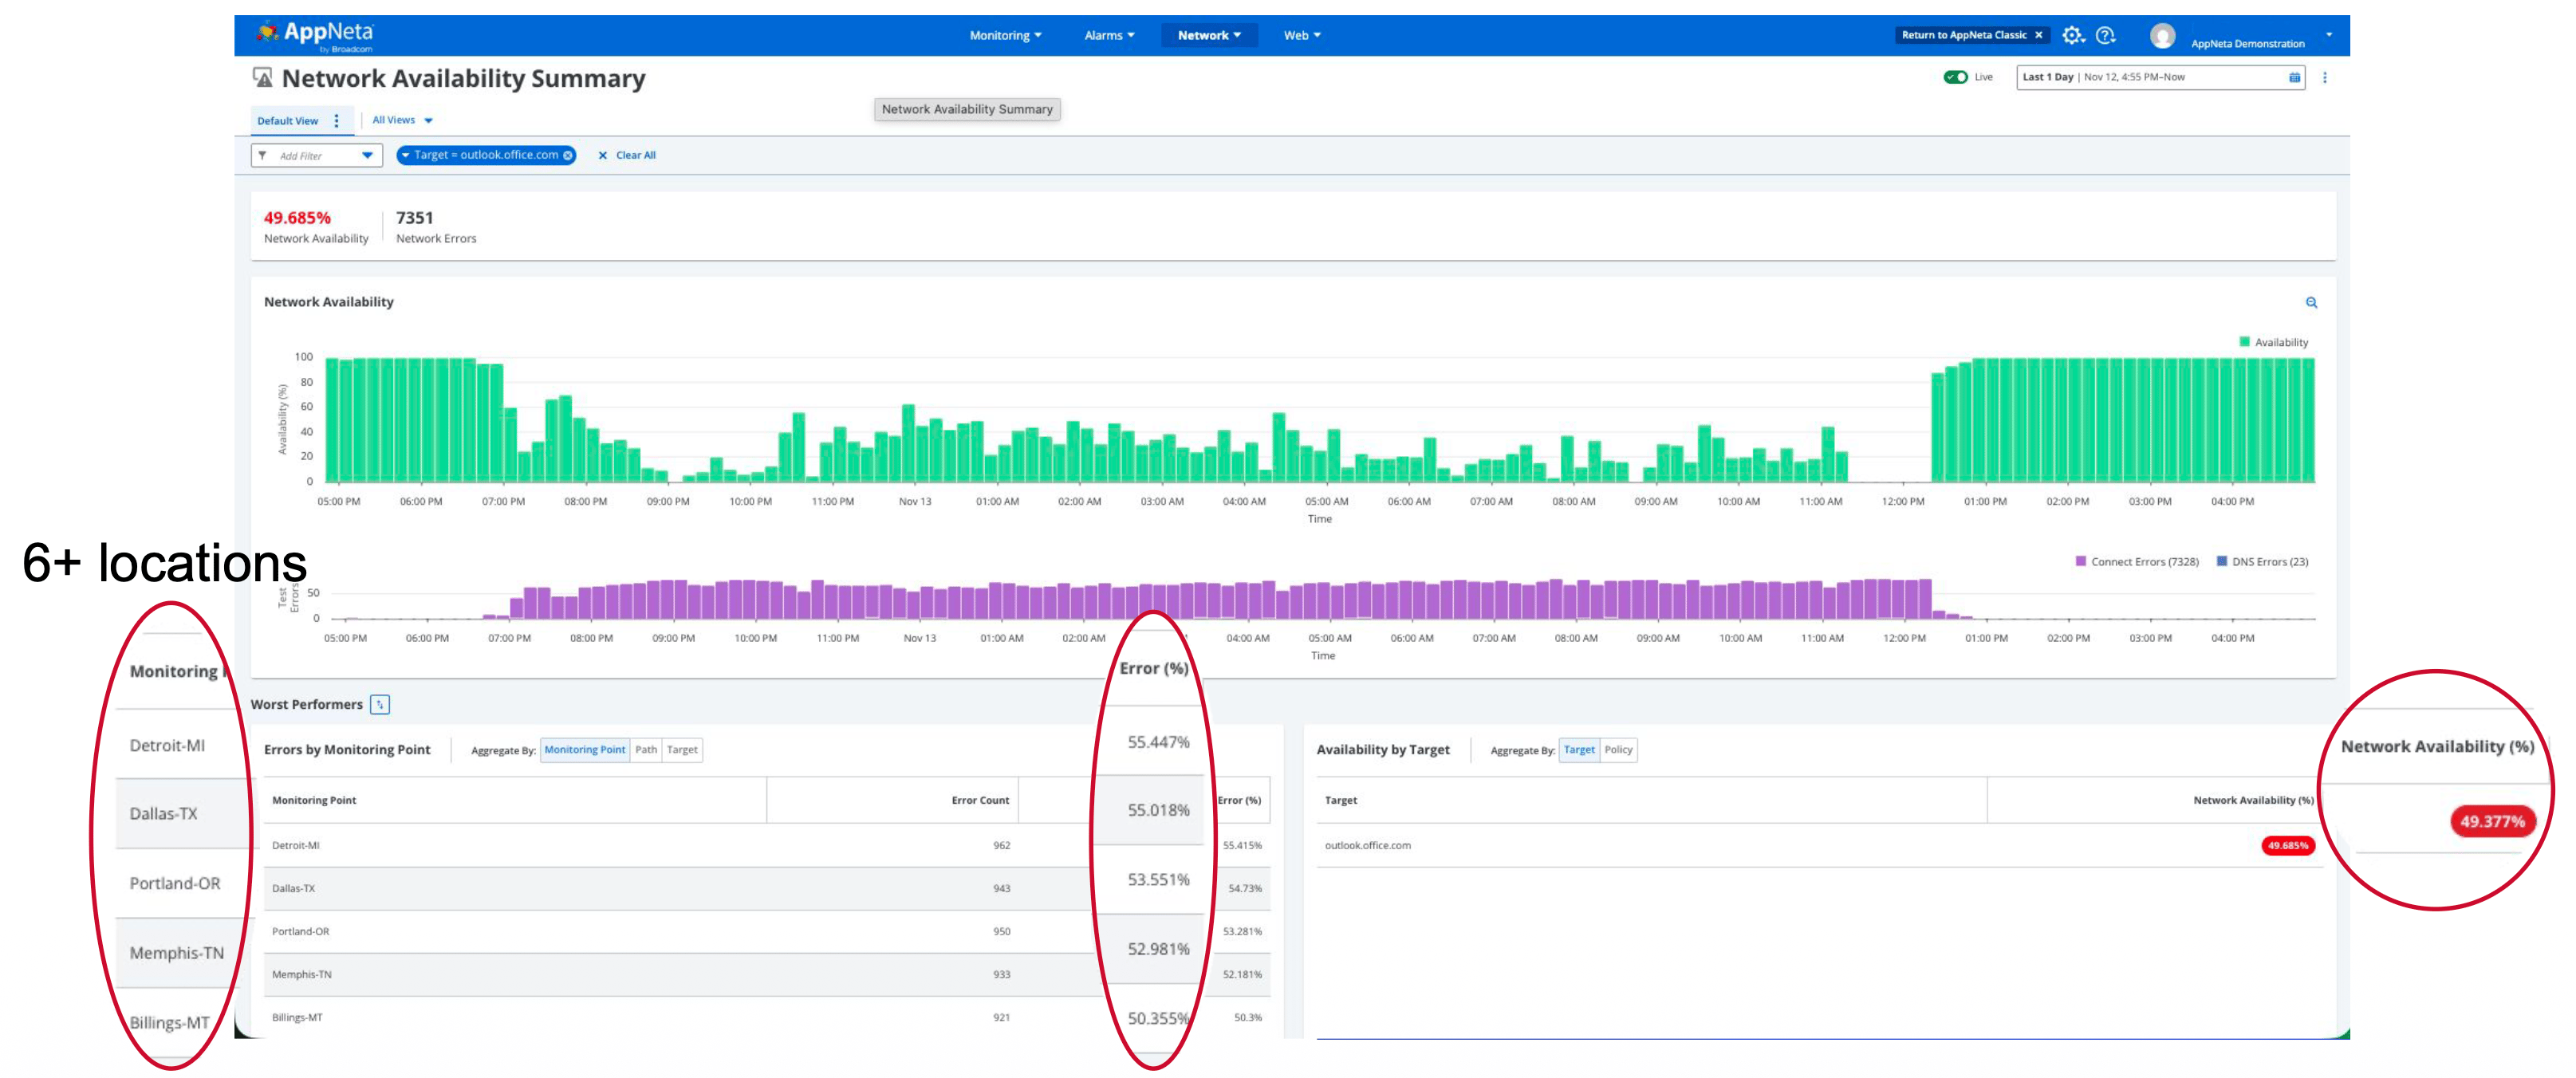
Service Health Summary Page showing the Error % from 6 US locations that are reporting low availability (49.377%) for network paths pointed at the outlook.office.com domain.
Broadcom has a demo environment that is set up to continuously test some of the most popular SaaS apps in the world. Our Alarm Console continued to show data loss to targets or extended Round Trip Time throughout the afternoon as reports circulated online of the outage.
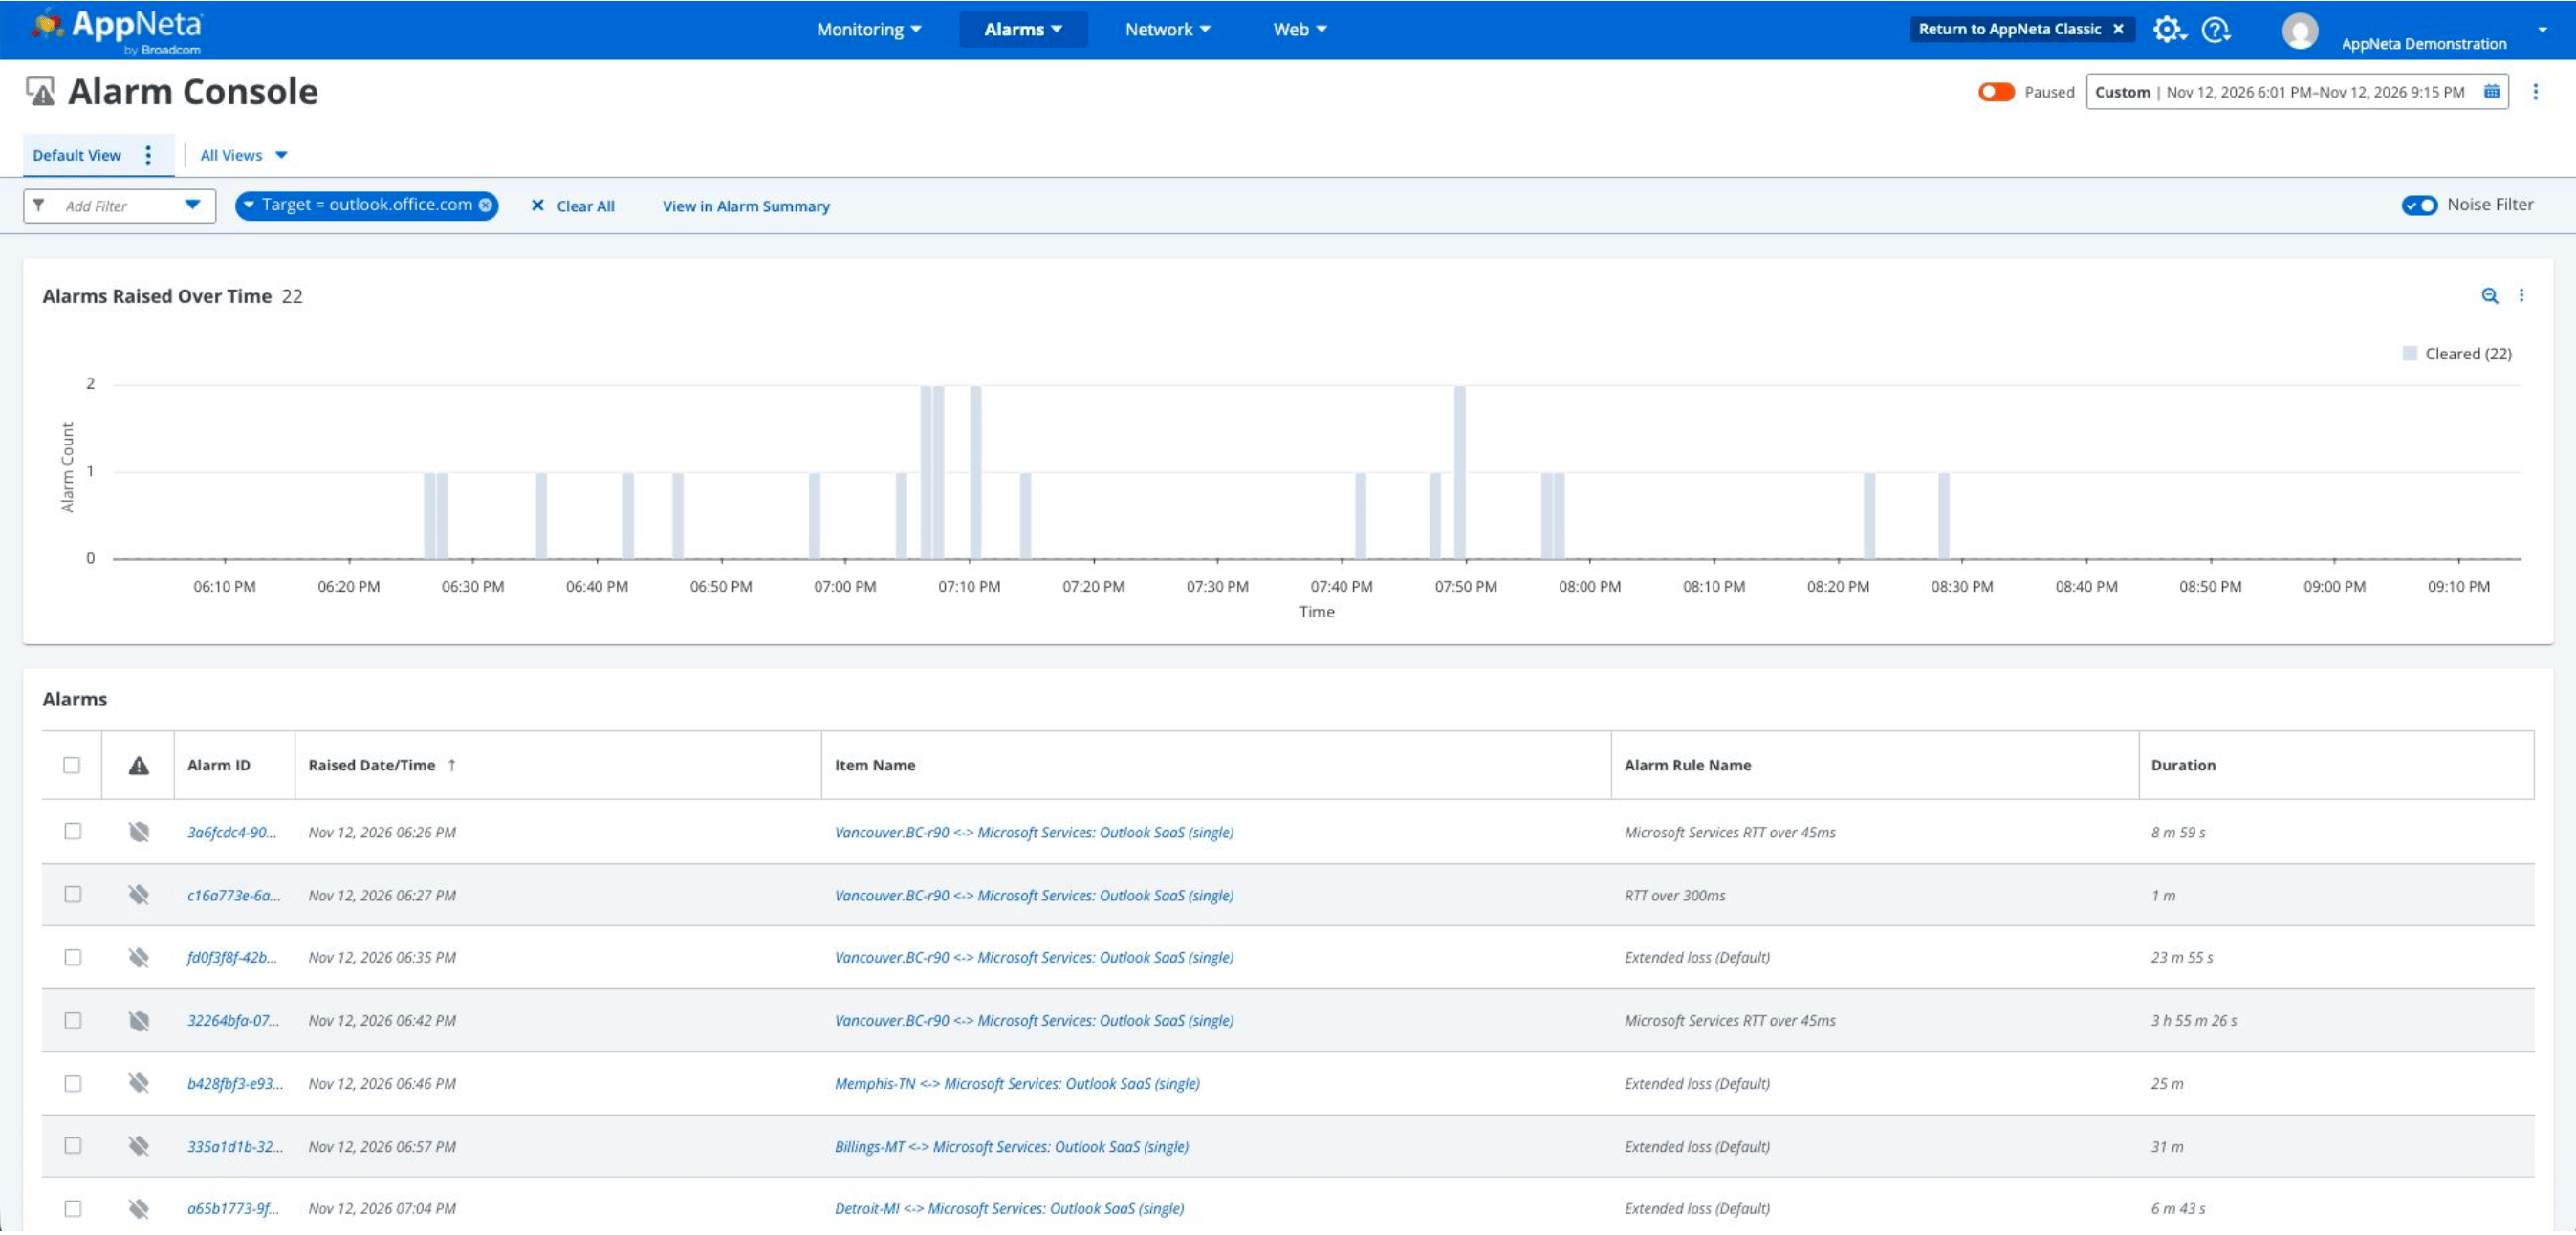
Intelligent alarms—AppNeta reported initial latency alarms before persistent packet loss issues impacted users.
Network Timeline
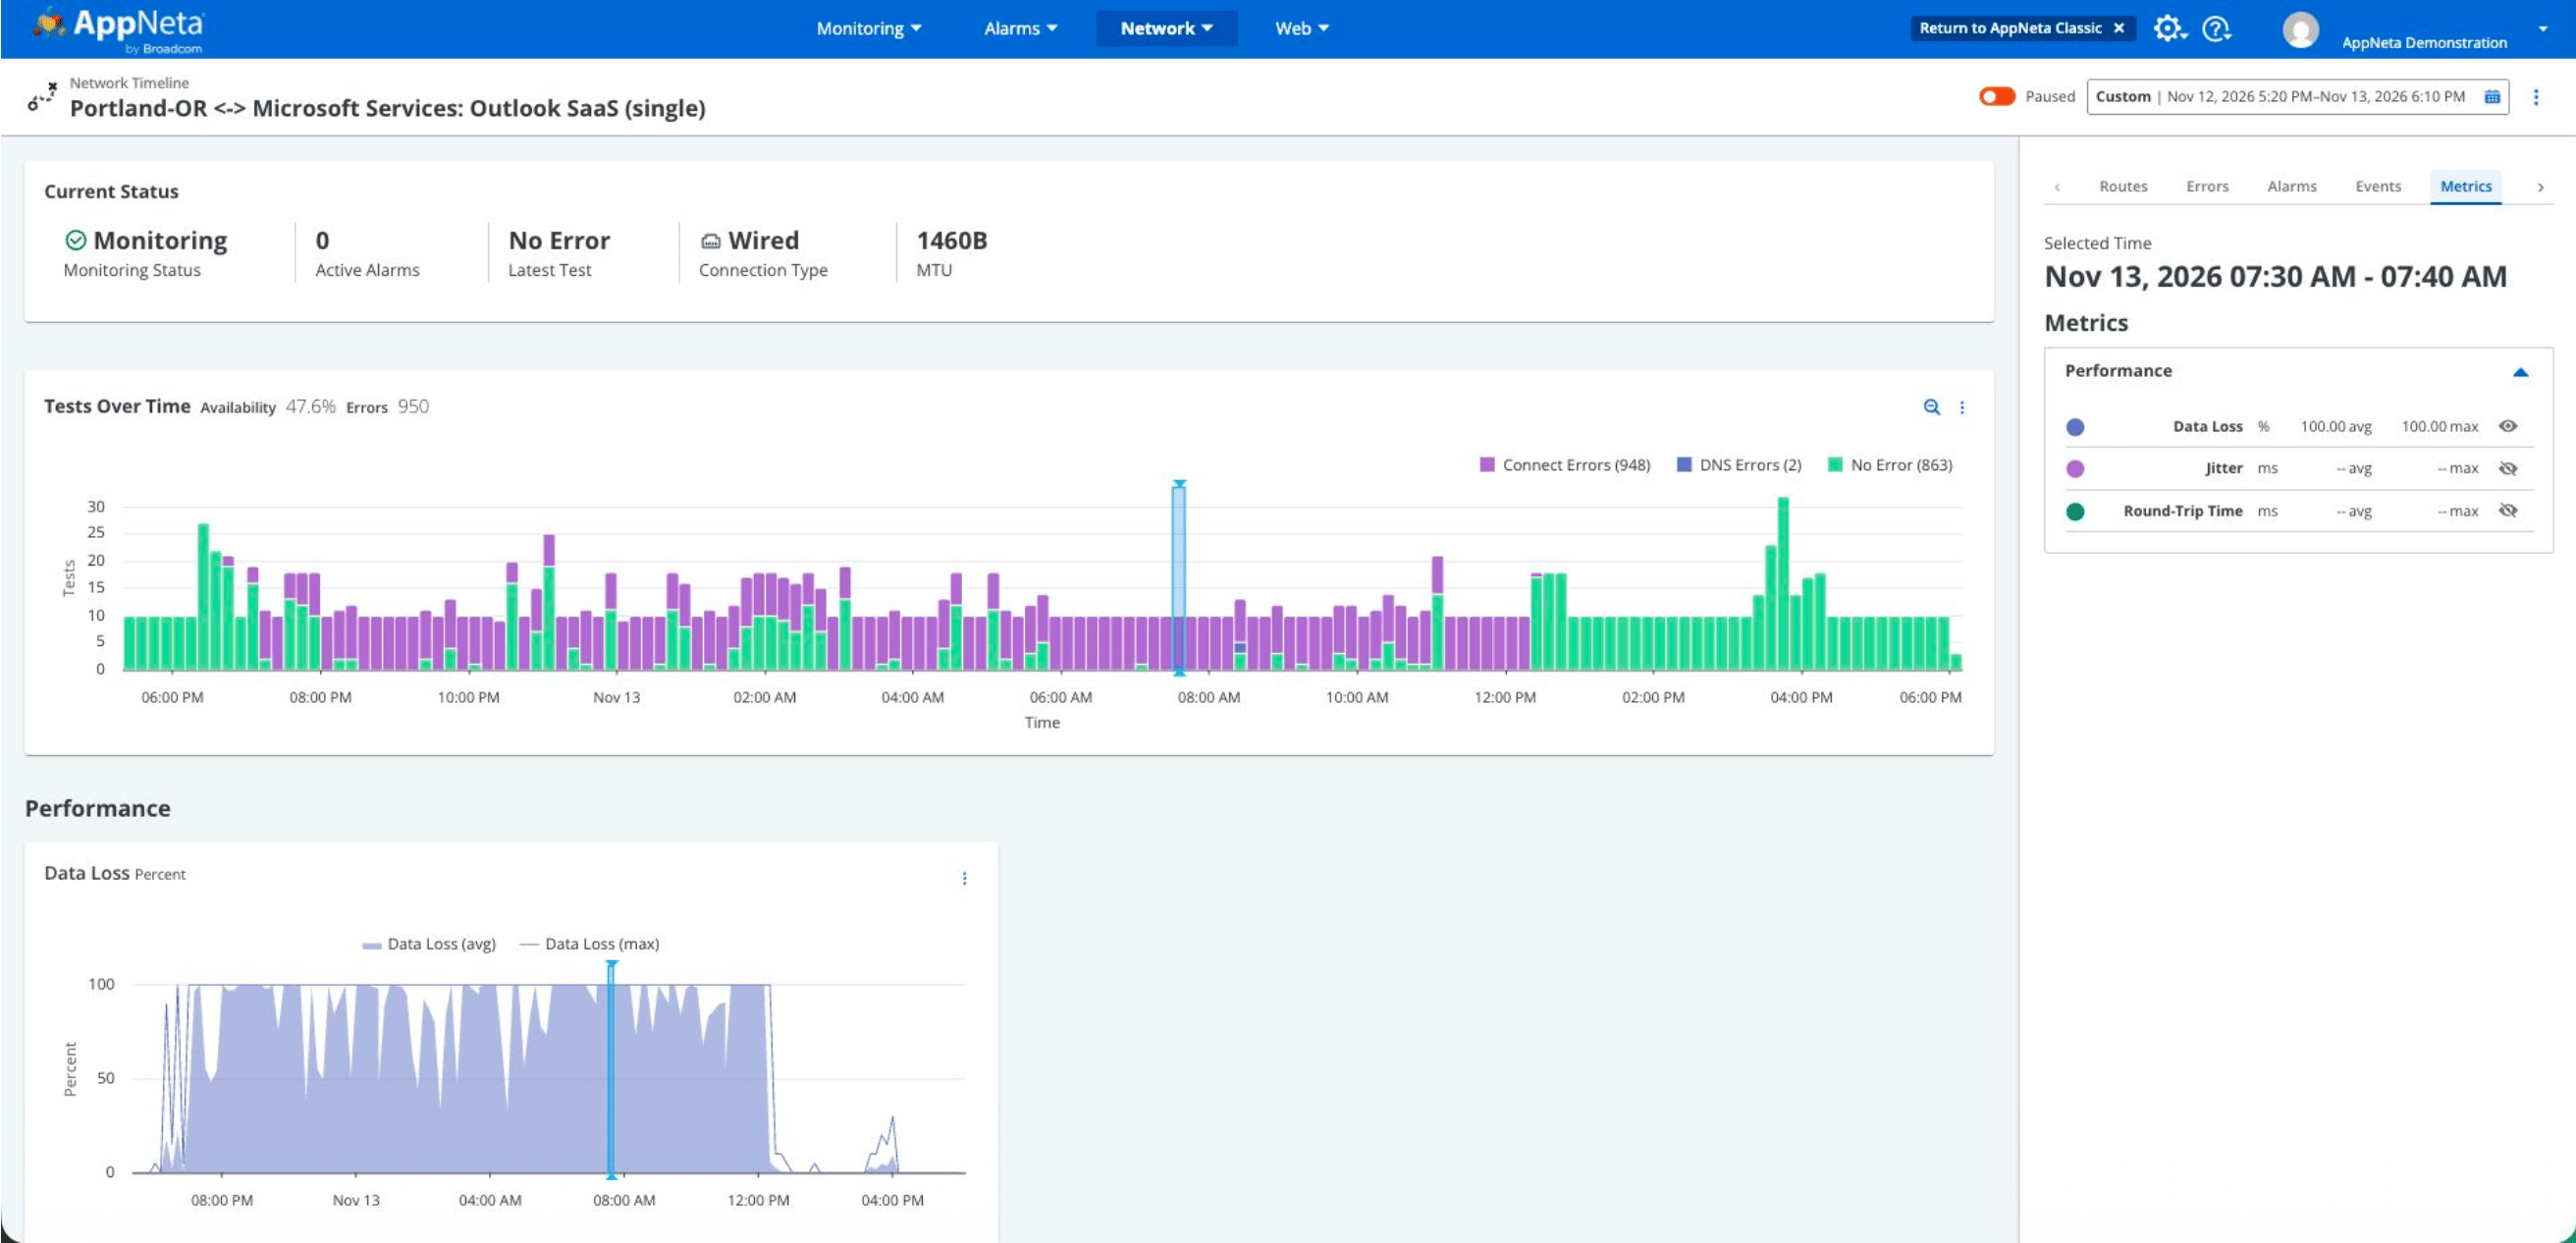
A Monitoring Point in North America detected the first connection errors at 17:40 UTC. Up to 6+ AppNeta locations also produced the same behavior. Viewing tests in our demo environment clearly indicated connection errors over time (in purple) for a 16-18 hour window from our Portland, Oregon Monitoring Point.
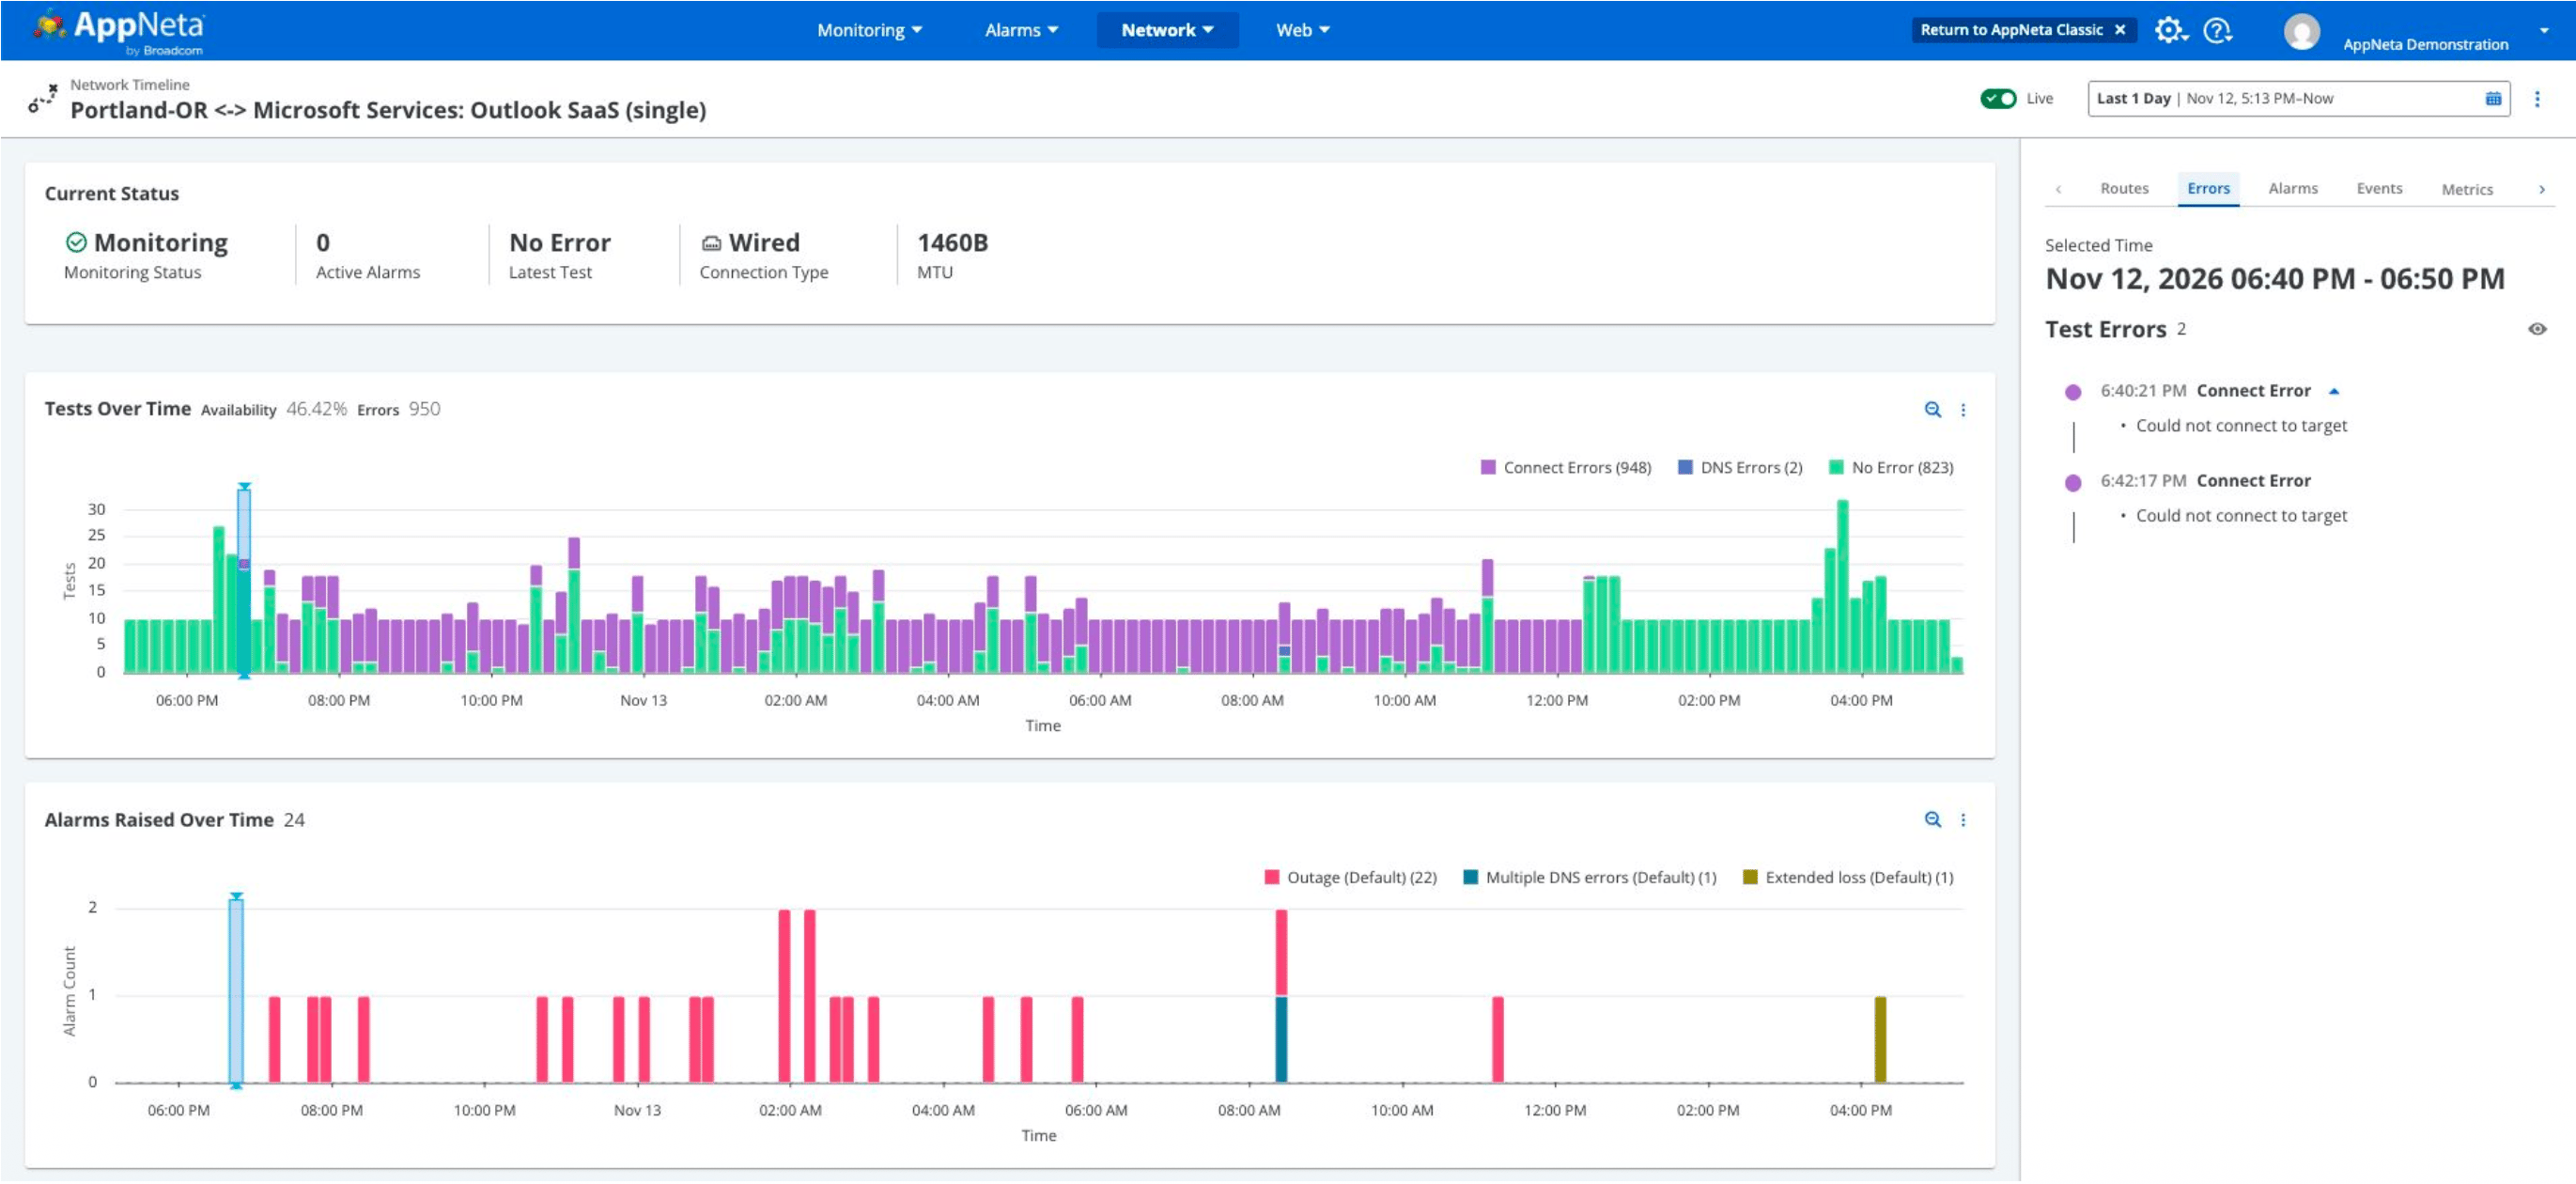
The connection error was both preceded and followed by route changes where AppNeta reported that the network path was intermittently unable to complete the route to destination. What AppNeta is able to show helps teams identify the macro-level problem domain; in this case, it is the application service provider network.
Seen in the AS-aggregated route visualization, AppNeta was able to quickly pinpoint that the error was not in internal infrastructure and not in the transit. This instantly shows the party responsible for the degradation and eliminates wasted cycles in the critical early phase of troubleshooting the incident.
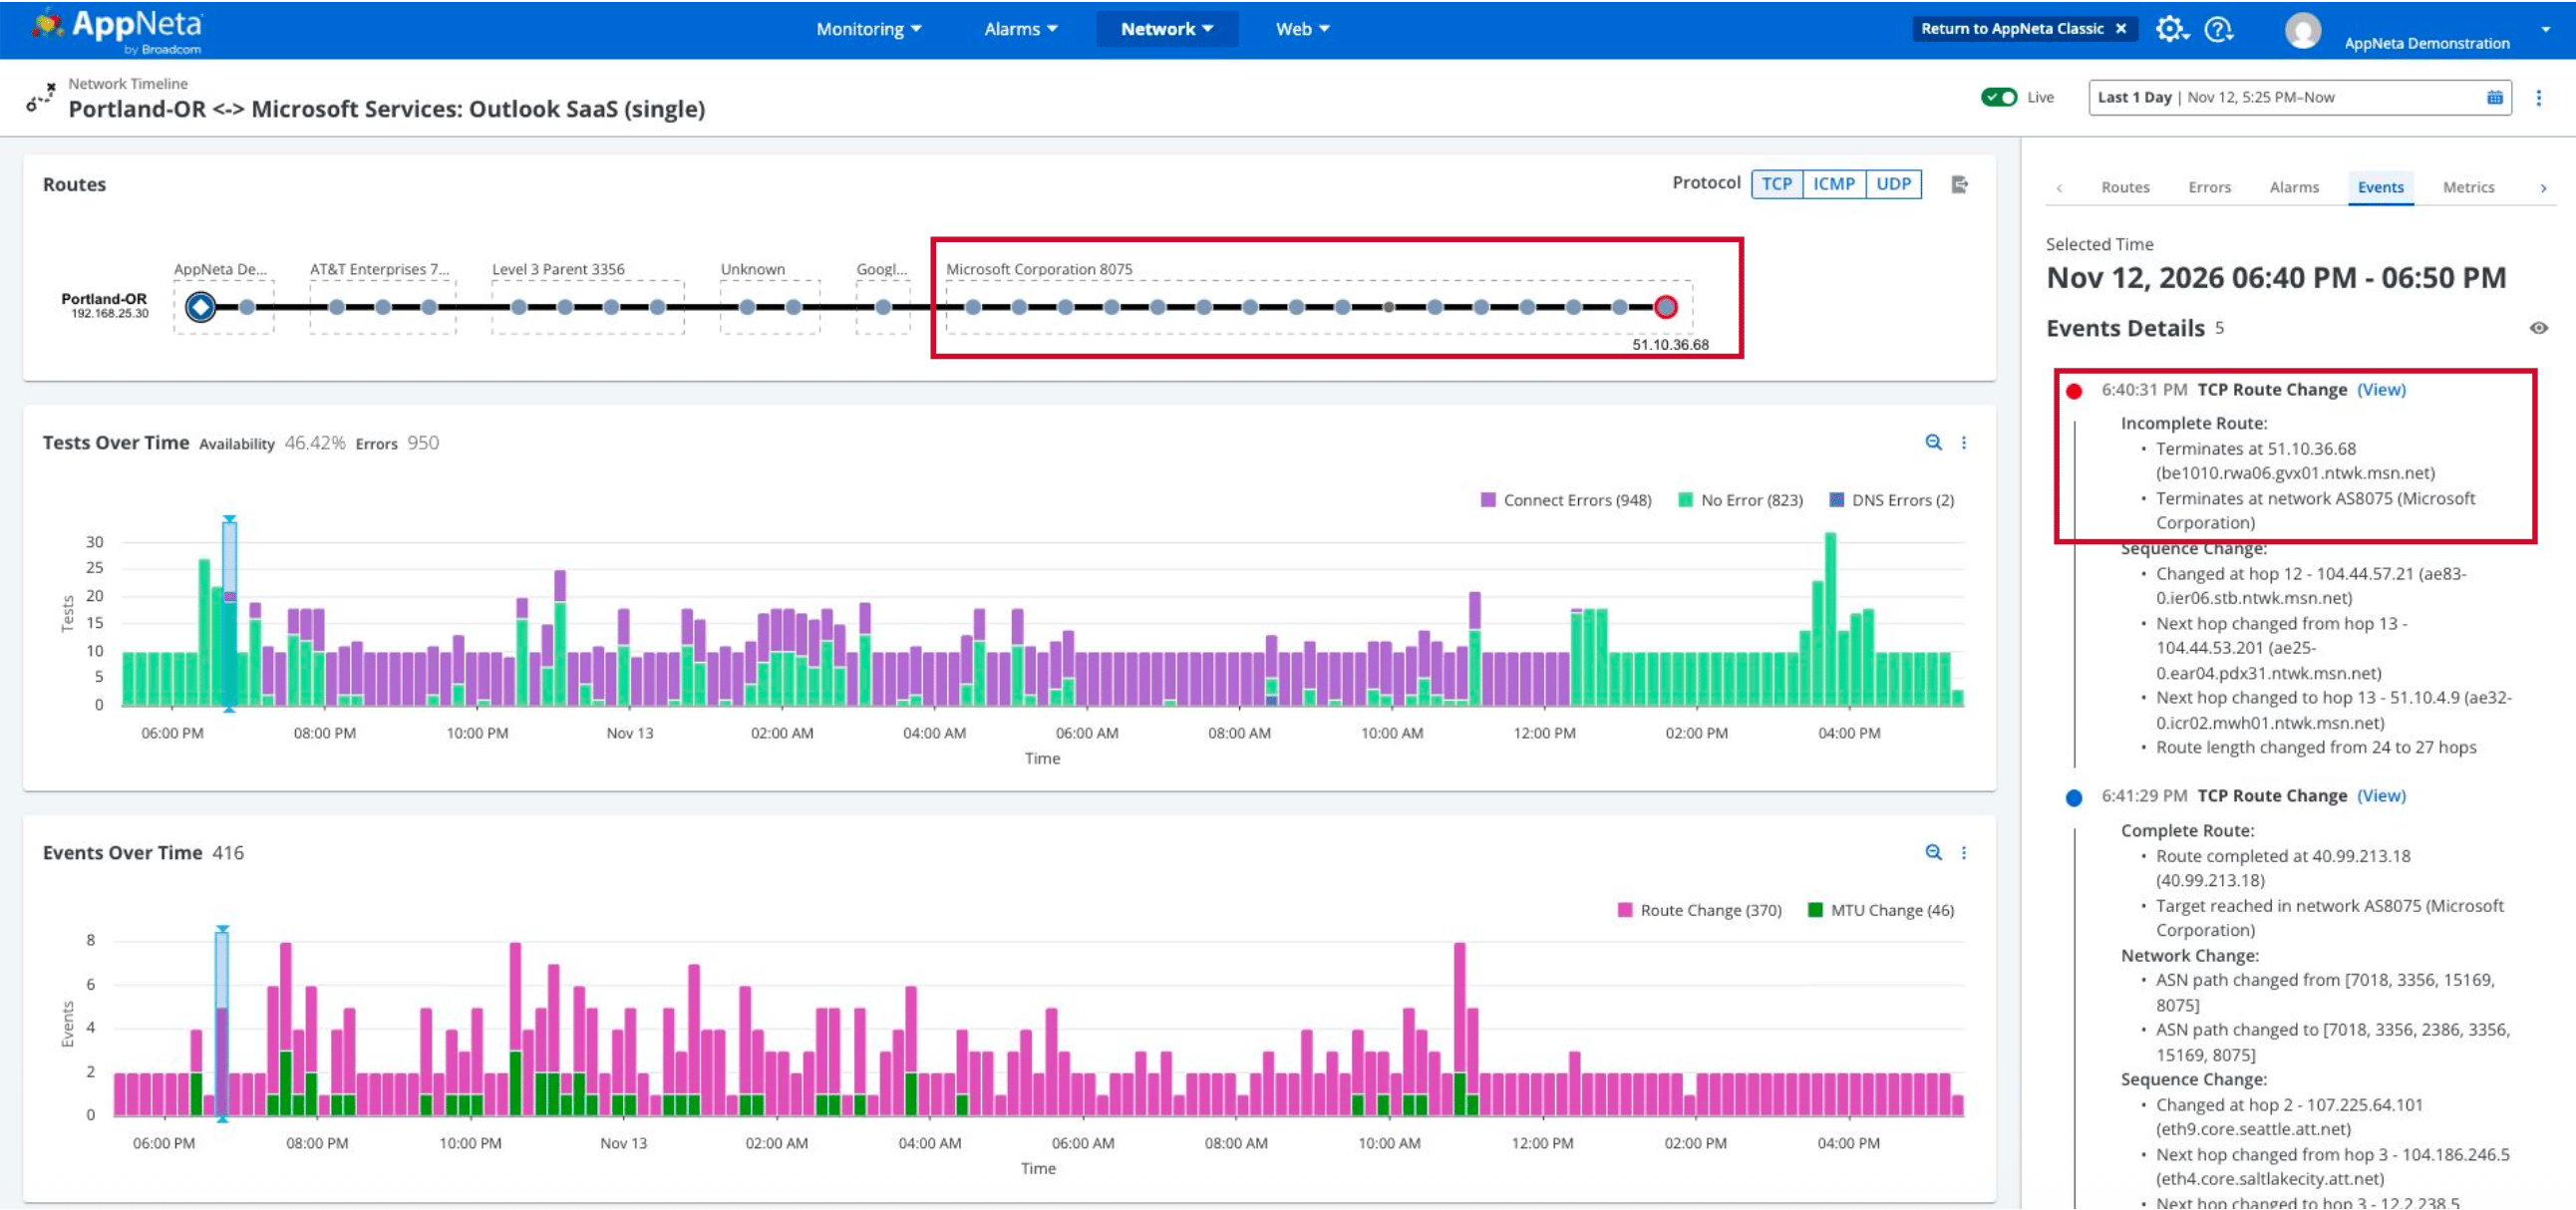
These network problems translated to confirmed issues for users in North America as a period of packet loss and intermittent to full inaccessibility until midday. While issues may be widespread, the focus on AppNeta is proving when your users are impacted rather than blanket statements of app outages that may not impact your organization.
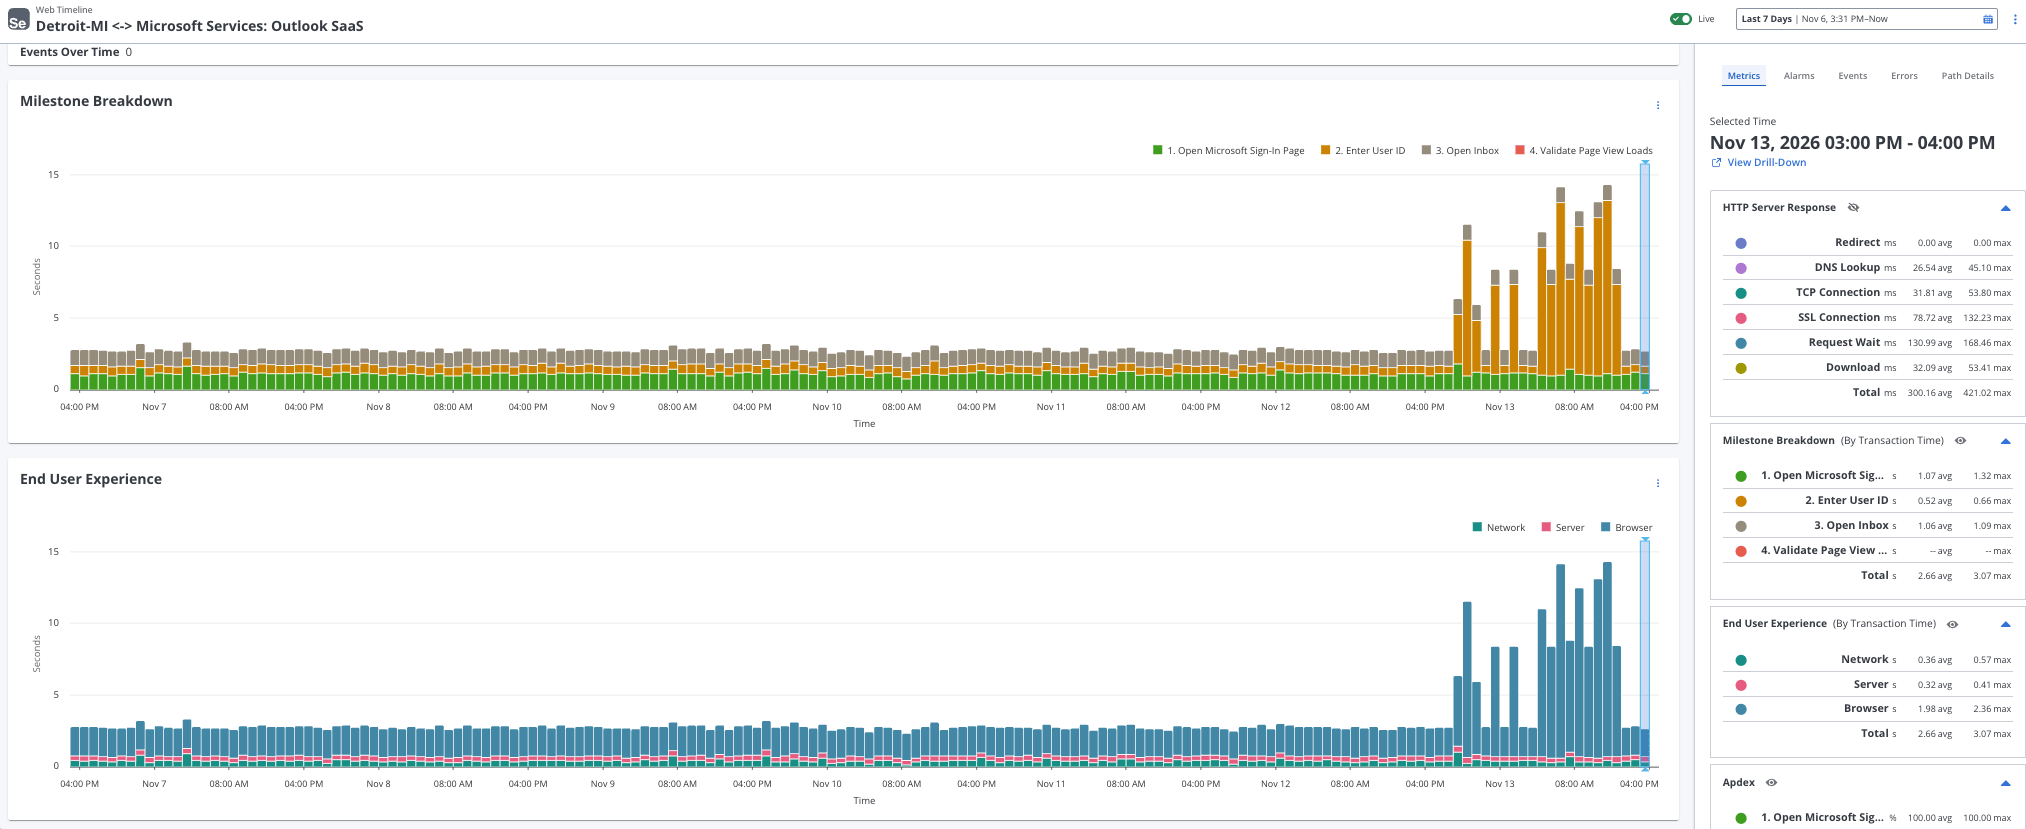
The core application issue could also be seen with AppNeta’s web testing that showed through scripts that user workflows were impacted beyond just the network connectivity to the domain.
Modern IT environments increasingly rely on interconnected cloud ecosystems and third-party SaaS applications to drive everyday business. Teams need visibility into external dependencies outside of their infrastructure when service disruptions occur across major providers. With continuous end-to-end network observability, operations teams can immediately differentiate between internal network issues and broader upstream service problems.
Network Observability by Broadcom, and specifically AppNeta, provides real-time path performance metrics along with actionable details during widespread outages. This information helps IT teams understand actual user impact and efficiently guide response strategies.
Since many major outages trace back to a single configuration change, that same continuous testing also lets the team confirm every change and leaves critical services intact.
Automate your response
Identifying an outage is only half the battle—the next step is fast, effective mitigation. With Network Observability by Broadcom and Automic Automation, alarms can automatically trigger health checks, initiate standard operating procedures, or execute targeted remediation workflows like this:
-
Check Hyperscaler’s Service Health and open a single incident with the evidence attached, instead of several duplicated tickets.
-
Notifies employees about the service degradation through channels that do not depend on Microsoft.
-
Pauses or reroutes business jobs that rely on impacted services (i.e. Exchange or Office365).
-
Resumes everything automatically once AppNeta confirms the service is stable again.
The result: hours of confusion become minutes of controlled response, and your business keeps running while the provider fixes its side. Take your IT operations to the next level by turning real-time observability into immediate, automated action.


