

What Is Network Flow Monitoring?
Network flow monitoring (also called network flow analysis or NetFlow monitoring) is the practice of collecting and analyzing flow records, which are summaries of the IP conversations that cross routers, switches, and firewalls.
Using protocols like NetFlow, Internet Protocol Flow Information Export (IPFIX), or sFlow, devices export these records to a flow collector. These flow records show who is using the network, which applications and protocols are being used, and how much bandwidth each conversation consumes. Network teams use flow data for network traffic analysis, bandwidth monitoring, capacity planning, quality of service (QoS) verification, and security forensics.
A flow is a set of packets that pass an observation point during a specific time interval. Flows share common properties, called flow keys (RFC 7011). The classic key is the 5-tuple: source and destination IP addresses, source and destination ports, and IP protocol.
What does a flow record contain?
A flow record contains these three elements:
-
Keys: Source and destination IP addresses, ports, IP protocol, Type of Service (ToS)/Differentiated Services Code Point (DSCP), and ingress and egress interfaces.
-
Counters: Bytes, packets, and, on some platforms, TCP flags.
- Context: Start and end timestamps, next hop, source and destination Autonomous System (AS), prefix masks, virtual local area networks (VLAN), and vendor or application fields in template-based formats.
Flow records carry no payload and, in standard formats, no per-packet latency, jitter, or loss metrics. Flow data tells you where to point packet analysis; it does not replace it.
Why does flow monitoring matter?
Flow monitoring matters because it provides important insights. Simple Network Management Protocol (SNMP) counters show how full a link is. On the other hand, flow data shows what is filling the link. With these insights, it is possible to assign a specific cause to a utilization alert. Here are some other important capabilities flow monitoring offers:
-
Encryption hides payload, not headers, so flow analysis still works on Transport Layer Security (TLS), QUIC (Quick UDP Internet Connections), and IPsec traffic.
-
Paths are less predictable with SaaS, cloud, and software-defined wide area networks (SD-WAN); flow records show the path traffic actually took.
-
Full packet capture does not scale to 10, 100, or 400 Gb/s links. In contrast, flow export, especially sampled export, can achieve this scale.
- Quality of service (QoS) needs verification: Per-DSCP flow views show whether each queue carries the traffic the policy intended.
How does flow monitoring work?
Flow monitoring works by aggregating individual network packets into conversation summaries through a structured, five-stage pipeline. The terms below follow the Internet Protocol Flow Information Export (IPFIX) architecture in RFC 7011.
To illustrate this division of responsibilities, the architecture diagram below maps the operational boundary between on-device packet processing and centralized collector analysis. It visualizes how network exporters aggregate raw packet headers into cached flow records before transmitting them across transport protocols to collectors for template decoding, metadata enrichment, and performance baselining.
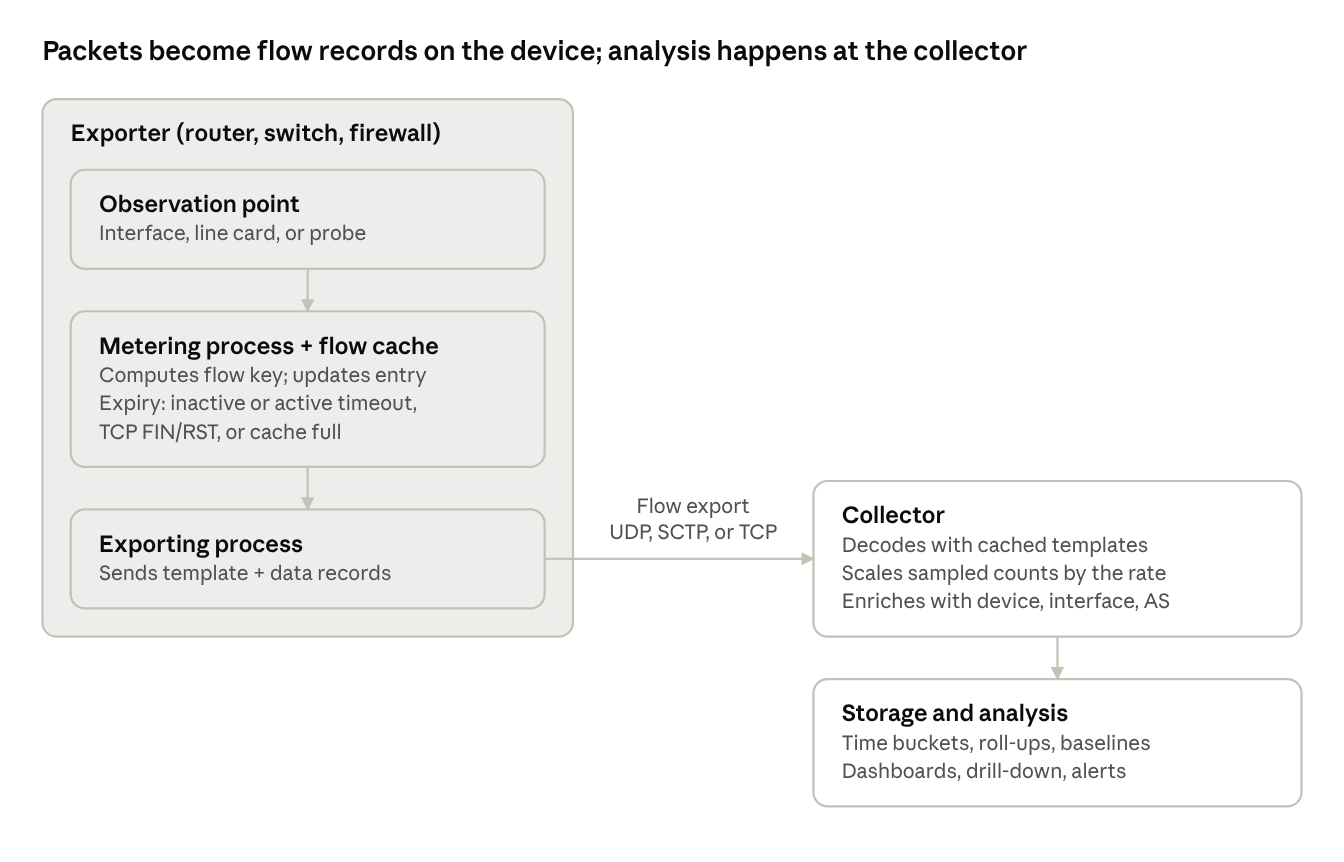
Figure 1: End-to-end network flow monitoring architecture. This diagram illustrates the flow lifecycle defined in RFC 7011, tracing how network devices aggregate packet headers into flow cache entries, evaluate active and inactive timeouts, export records across transport protocols (UDP, SCTP, or TCP), and enrich aggregated flow data with device, interface, and Autonomous System (AS) context for reporting and anomaly detection.
The exporting device does the aggregation. Everything after export happens on collector infrastructure that you size and operate. Here are the five stages:
Observation point
The interface, line card, or probe where packets are seen. Each belongs to an observation domain identified in every export message.
Metering
The device reads headers (or a sample), computes the flow key, and creates or updates a flow cache entry.
Expiry
An entry is exported when its inactive timeout passes with no packets, its active timeout passes on a still-running flow (so long flows show up before they end), a TCP FIN or RST packet is seen, or the cache is full.
Export
Records go to one or more collectors. NetFlow v9 and IPFIX send template records first, then data records that reference them.
Collection and analysis
The collector decodes records. It then enriches records with device, interface, application, and Autonomous System (AS) names. The collector then aggregates them into time buckets. Finally, it stores records for queries, dashboards, baselines, and alerts.
Two consequences follow:
-
Multiple record generation: A flow longer than the active timeout appears as several records, so sum them rather than count them.
-
Delayed traffic arrival: A long active timeout results in traffic arriving late. In addition, this traffic appears in bursts on time-series charts.
Which flow export protocols are in use?
Flow-caching protocols (such as NetFlow and Internet Protocol Flow Information Export [IPFIX]) aggregate packets into records on the device. Packet-sampling protocols (such as sFlow) export sampled headers and leave aggregation to the collector.
| Protocol | Standard | Record format | Data source | Transport | Notable traits |
|---|---|---|---|---|---|
| NetFlow v5 | Vendor format (Cisco) | Fixed | Flow cache, optional sampling | UDP | IPv4 only; no new fields |
| NetFlow v9 | RFC 3954 (Informational) | Template-based | Flow cache, optional sampling | UDP | IPv6, MPLS, custom fields; basis for IPFIX |
| IPFIX | RFC 7011 (Internet Standard, STD 77) | Template-based; IANA and enterprise elements | Flow cache; PSAMP packet selection | SCTP, TCP, or UDP; TLS/DTLS | Version 10; sequence numbers expose lost records; variable-length fields |
| sFlow | RFC 3176 (v4); later versions from sFlow.org | Fixed XDR | Random 1-in-N packet sampling plus interface counters | UDP, default port 6343 | Exports raw header bytes (default 128); no device flow cache |
Vendor variants such as Flexible NetFlow, J-Flow, NetStream, and AppFlow use NetFlow v9 or IPFIX encodings. Use IPFIX where devices support it, sFlow on high-port-count switches that lack hardware flow caches, and NetFlow v5 only as a fallback.
What problems do teams face without flow monitoring?
Without flow data, teams can see that something is wrong but not why. Here are some of the limitations of working without flow data:
-
Congestion without a culprit: Counters show a saturated link, not the hosts or applications on it.
-
Capacity planning by averages: Upgrades are sized without knowing whether growth comes from business traffic or from deferrable backups and updates.
-
Unverified quality of service (QoS): Misclassified or re-marked traffic lands in the wrong queue, and the resulting problems are blamed on the carrier.
-
Security blind spots: No history of scans, lateral movement, unexpected protocols, or large outbound transfers.
-
Slow mean time to innocence: No quick proof of whether a slow application's traffic crossed a congested path.
- No cost allocation: Transit, peering, cloud egress, and WAN costs cannot be attributed to sites, departments, or Autonomous System (AS) neighbors.
Network Observability Maturity Model
Learn more about the challenges of establishing effective network performance management and gain a blueprint for advancing your capabilities.
Read the White Paper →How does flow data compare with Simple Network Management Protocol (SNMP) and packet capture?
Compared with Simple Network Management Protocol (SNMP) and packet capture, flow data varies in terms of its comprehensiveness. Flow sits between SNMP and interface counters and full packet capture. Teams with mature monitoring practices use all three. Here is more information on how each of these approaches compare:
| What you need | SNMP or streaming interface counters | Flow records (NetFlow, IPFIX, sFlow) | Full packet capture |
|---|---|---|---|
| Unit of data | Per-interface counters (octets, packets, errors, discards) | One record per conversation per export interval | Every packet, headers and payload |
| Answers | How busy is this link? Is it dropping or erroring? | Who is using this link, with what, and to where? | Exactly what happened in this transaction? |
| Traffic attribution | None | Host, port, protocol, DSCP, AS, interface | Complete |
| Payload visibility | None | None | Yes, unless encrypted |
| Latency, jitter, and loss per flow | No | Not in standard records | Yes, derivable |
| Storage and processing cost | Very low | Moderate; scales with flow count | Very high; scales with traffic volume |
| Practical coverage | Every device and interface | Every exporting device, continuously | Selected links, short windows |
| Typical use | Health, utilization, thresholds, capacity trends | Traffic engineering, QoS verification, security forensics, cost allocation | Deep troubleshooting, protocol analysis |
In a typical workflow, an SNMP alert identifies the interface, flow analysis identifies the conversations, and packet capture is used only if the flow evidence points to a protocol-level problem.
What capabilities should a flow monitoring tool have?
The key test is whether the tool ties flow to the devices, interfaces, and metrics you already monitor. Here are some of the key capabilities required:
What should you consider when designing a flow deployment?
When designing a flow deployment, it is important to consider the architecture design. Flow data quality depends more on careful architecture design than on the choice of tools employed.
Sampling rate and accuracy
With random 1-in-N sampling, a traffic class's estimate is its sample count × N. At 95% confidence, the error depends only on c, the number of samples seen for that class (Source: sFlow.org, “Packet Sampling Basics”).
About 1,000 samples produce roughly 6% error rates; nine samples give about 65%. Choose the sampling rate for the smallest class you need to see in your shortest reporting interval, and sample randomly rather than every Nth packet (RFC 3176).
Cache timeouts
Keep the active timeout shorter than your reporting interval so that busy flows are not reported as one spike when they end. Defaults vary by platform, so check them.
Export placement
-
Export at one consistent point per link (usually ingress on every interface) to avoid double counting.
-
Where a path crosses several exporters, de-duplicate or scope reports per device.
-
Use a loopback address or a stable management address as the export source.
Collectors and transport
Collect flow near the exporters and forward only aggregates to keep raw export off the wide area network (WAN). Over User Datagram Protocol (UDP), templates are resent periodically and expire if not refreshed. Internet Protocol Flow Information Export (IPFIX) sequence numbers let the collector count lost records (RFC 7011).
Identity and time
Keep Simple Network Management Protocol (SNMP) ifIndex values persistent across reboots. Also, synchronize exporters and collectors with Network Time Protocol (NTP) so flow, SNMP, and syslog data line up. If the interface numbers shuffle after a reboot, your historical flow data gets scrambled. For example, traffic that happened on port A now looks like it happened on port B, or the flow collector drops the data because the IDs no longer match what SNMP reported.
Security and privacy
NetFlow and sFlow exports are unencrypted; the sFlow specification recommends a secured measurement network such as a dedicated virtual local area network (VLAN) or virtual private network (VPN) (RFC 3176). Internet Protocol Flow Information Export (IPFIX) supports Transport Layer Security (TLS) and Datagram Transport Layer Security (DTLS). Accept data only from known exporters, restrict flow data by role, and match retention to your data protection policy, because flow records reveal user activity.
What can you do with flow data?
Network flow data enables engineering and security teams to transform raw bandwidth alarms into actionable conversation intelligence across performance troubleshooting, capacity forecasting, and policy enforcement. By correlating endpoints, protocols, and traffic volume per conversation, teams leverage flow telemetry across five primary operational use cases:
| Use case | Question flow answers | How it is done | Metric to track |
|---|---|---|---|
| Congestion triage | What is filling this interface right now? | Drill from the saturated interface to top protocols, hosts, and conversations for the alert window | Time from utilization alert to identified cause |
| Capacity planning | Which applications and sites drive growth? | Trend per-protocol and per-site volume over months; separate business traffic from deferrable traffic | Forecast versus actual utilization at upgrade time |
| QoS verification | Is each traffic class marked and carried as designed? | Compare per-ToS/DSCP volume and protocol mix against the QoS policy on each hop | Share of traffic in an unexpected class |
| Security and forensics | Who connected to what, when, and how much moved? | Look for new protocols, scans, fan-out, and unusual outbound volume; retain history for investigations | Detection-to-scope time during incidents |
| Peering, transit, and cost allocation | Which AS neighbors, sites, or departments consume paid bandwidth? | Aggregate by source/destination AS, next hop, or site prefix | Cost per site or per AS neighbor |
During triage, an engineer opens the flow view of the alerting interface for the same time window, identifies the protocol that increased, drills into its hosts and conversations, and compares the protocol with its baseline, all without leaving the interface's context.
How does flow monitoring fit within network observability?
Flow is the traffic-composition layer of observability: Metrics say a link is congested, flow says what is congesting it, and configuration history says what changed first. That combination works only when three conditions hold:
-
Shared object identity: Ensure the flow collector and the Simple Network Management Protocol (SNMP) poller agree that exporter 10.1.1.1, ifIndex 12, is edge-rtr-01 Gi0/0/1.
-
A common time base: Use Network Time Protocol (NTP) everywhere, and keep active timeouts short enough so that flow does not lag metrics.
-
One navigation path: Track the path from an interface's utilization chart to its flow breakdown, using same time range, without having to switch tools.
Advanced network observability solutions meet these conditions by storing NetOps Flow data with SNMP performance data. Consequently, flow views open from the same device and interface context pages as utilization and threshold views.
What Is Network Observability?
Ready to see how these localized telemetry streams combine into end-to-end delivery path visibility? Read our complete guide to modern network observability.
Read the Complete Guide →